To mark the release of our most recent research data on the American digital consumer – collected via our expanded sample of 30,000 US internet users – we created an interactive infographic, exploring the cross-platform digital behaviors of a variety of American audiences.
The interactive infographic quantifies the popularity of 37 key digital behaviors among 49 US audiences, which are also broken down at state level.
The audiences, and their corresponding definitions, are as follows:
- Average US Internet User: Lives in “USA” AND Active Internet User
- Community Builders: Lives in “USA” AND Active Internet User AND “Strongly Agree: I think it is very important to contribute to the community”
- Risk Takers: Lives in “USA” AND Active Internet User AND “Strongly Agree: I like to take risks”
- Financial Optimists: Lives in “USA” AND Active Internet User AND “Strongly Agree: I feel positive about the global economy”
- Ambitious Achievers: Lives in “USA” AND Active Internet User AND “Strongly Agree: I always strive to achieve more in life”
- Silver Surfers: Lives in “USA” AND Active Internet User AND aged 60+
- Generation X: Lives in “USA” AND Active Internet User AND aged 33-52
- Generation Y: Lives in “USA” AND Active Internet User AND aged 16-32
- Boomerang Kids: Lives in “USA” AND Active Internet User AND aged 20-29 AND live with parents
- College Kids: Lives in “USA” AND Active Internet User AND working status “student”
- Asian Americans: Lives in “USA” AND Active Internet User AND ethnicity “Asian”
- African Americans: Lives in “USA” AND Active Internet User AND ethnicity “African American”
- Hispanic Americans: Lives in “USA” AND Active Internet User AND ethnicity “Hispanic”
- Fitness Fanatics: Lives in “USA” AND Active Internet User AND “Strongly Interested: Health Fitness” AND “Strong Interested: My appearance / image”
- Sports Players: Lives in “USA” AND Active Internet User AND “Strongly Interested: Playing Sport” AND “People Regularly Ask Me Questions About: Sport”
- Sports Fans: Lives in “USA” AND Active Internet User AND “Strongly Interested: Watching Sport” AND “People Regularly Ask Me Questions About: Sport”
- Travel Explorers: Lives in “USA” AND Active Internet User AND “Strongly Interested: Travel” AND “People Regularly Ask Me Questions About: Travel” AND “Bought Holiday Abroad”
- Culture Vultures: Lives in “USA” AND Active Internet User AND “Strongly Interested: Fine Art / Culture” AND “People Regularly Ask Me Questions About: Fine Art / Culture”
- Celebrity Gossipers: Lives in “USA” AND Active Internet User AND “Strongly Interested: Celebrity News / Gossip” AND “People Regularly Ask Me Questions About: Celebrity News / Gossip”
- Film Buffs: Lives in “USA” AND Active Internet User AND “Strongly Interested: Films” AND “People Regularly Ask Me Questions About: Films” AND “Bought Films: Past Month”
- Petrol Heads: Lives in “USA” AND Active Internet User AND “Strongly Interested: Cars / Auto” AND “People Regularly Ask Me Questions About: Cars / Auto” AND “Bought Car”
- Environmentalists: Lives in “USA” AND Active Internet User AND “Strongly Interested: Environment” AND “People Regularly Ask Me Questions About: Environmental Issues”
- Fashion Leaders: Lives in “USA” AND Active Internet User AND “Strongly Interested: Fashion” AND “People Regularly Ask Me Questions About: Fashion”
- Photo Fanatics: Lives in “USA” AND Active Internet User AND “Strongly Interested: Photography” AND “Uploaded Photos: Past Month”
- Food Lovers: Lives in “USA” AND Active Internet User AND “Strongly Interested: Food / Cooking” AND “People Regularly Ask Me Questions About: Food / Restaurants”
- Music Fans: Lives in “USA” AND Active Internet User AND “Strongly Interested: Music” AND “People Regularly Ask Me Questions About: Music” AND “Bought Music: Past Month”
- Home Improvers: Lives in “USA” AND Active Internet User AND “Strongly Interested: DIY / Decorating”
- High Income Families: Lives in “USA” AND Active Internet User AND (“HH Income $125K > $150K” OR “HH income $150K+”) AND “Kids in HH”
- Middle Income Families: Lives in “USA” AND Active Internet User AND “Mid-50% Income Segment”
- Low Income Families: Lives in “USA” AND Active Internet User AND “<$50k Annual HH Income” AND “Kids in HH”
- American Moms: Lives in “USA” AND Active Internet User AND “Children in the HH” AND “Female”
- American Dads: Lives in “USA” AND Active Internet User AND “Children in the HH” AND “Male”
- Entrepreneurs: Lives in “USA” AND Active Internet User AND (“Company Owner” OR “Self-Employed”)
- Business Leaders: Lives in “USA” AND Active Internet User AND ((“Company Owner” OR “Senior Manager”) AND (“250>500 Company Size” OR “500+ Company Size”))
- Government Workers: Lives in “USA” AND Active Internet User AND (“Work in Education” OR “Work in Government” OR “Work in Police / Armed Forces”)
- Private Sector Workers: Lives in “USA” AND Active Internet User AND “Work Full-Time” NOT (“Work in Education” OR “Work in Government” OR “Work in Police / Armed Forces”)
- Part-Time Workers: Lives in “USA” AND Active Internet User AND “Work Part-Time”
- Premium Product Buyers: Lives in “USA” AND Active Internet User AND “Strongly Agree: I tend to buy the premium version of the product”
- Impulse Buyers: Lives in “USA” AND Active Internet User AND “Strongly Agree: I make decisions based on gut feel”
- Brand Loyalists: Lives in “USA” AND Active Internet User AND “Strongly Agree: When I find a brand I like I tend to stick to it”
- Apple Fanboys: Lives in “USA” AND Active Internet User AND “Apple Owners” AND “Would Definitely Recommend: Apple”
- Samsung Fanboys: Lives in “USA” AND Active Internet User AND “Samsung Owners” AND “Would Definitely Recommend: Samsung”
- Console Gamers: Lives in “USA” AND Active Internet User AND “Played Console Online (Past Month)” AND “Played Console Offline (Past Month)”
- Mobile Gamers: Lives in “USA” AND Active Internet User AND “Played Mobile Games (Past Month)”
- Digital Couch Potatoes: Lives in “USA” AND Active Internet User AND “Watch Video Online” AND “Watch Full-Length TV Shows / Films Online”
- Analogue Couch Potatoes: Lives in “USA” AND Active Internet User AND “Watch TV: 6+ Hours A Day”
- Republican Party Voters: Lives in “USA” AND Active Internet User AND “Voting Preference: Republican”
- Democratic Party Voters: Lives in “USA” AND Active Internet User AND “Voting Preference: Democrat”
- Independent Voters: Lives in “USA” AND Active Internet User AND “Voting Preference: Independent / No Preference”
The 37 behaviors explored are:
- Internet Banking
- Watched A Video Clip
- Checked The Weather Online
- Played An Online Game
- Used Webmail
- Purchased A Product Online
- Search For Product Or Service To Buy
- Used A Social Networking Service
- Reviewed A Product Or Brand Online
- Managed Your Social Network Profile
- Uploaded Photos Online
- Used Instant Messenger
- Checked Information On Music, Leisure Or Entertainment
- Asked Or Answered A Question On A Question And Answer Services (i.e. Yahoo Answers or Quora)
- Listen To Music On A Music Streaming Service
- Watched A Full-Length Film
- Purchased An Online Service
- Watch Television Shows On Demand (Not Live) Through An Internet Service
- Listened To Live Radio Online
- Searched Using A Location Based Service
- Commented On A Story
- Bought A Product Or Service Through A Group-Buying Website (i.e. Groupon)
- Watched A Full-Length Sports Programme
- Uploaded A Video Online
- Sold A Product Online
- Listened Or Watched A Podcast
- Streamed A Full-Length TV Show Live
- Used Online Office Applications
- Edited/Managed Own Website
- Used A Social Bookmark Service
- Used A Micro-Blogging Service
- Posted A Comment On A Forum/Message Board/BBS Website
- Written Your Own Blog
- Made A Phone Call Online / Used VOIP
- Written A News Story/Article
- Subscribed To An RSS Feed
- Used An Aggregator
All behaviors are spit by PC/laptop, tablet and mobile, offering a view on how the digital habits of these audiences vary according to the device they are using.
How To Use The Infographic
To manipulate the output of the interactive infographic, users can select one behavior and one platform (PC/laptop, tablet or mobile) at a time:
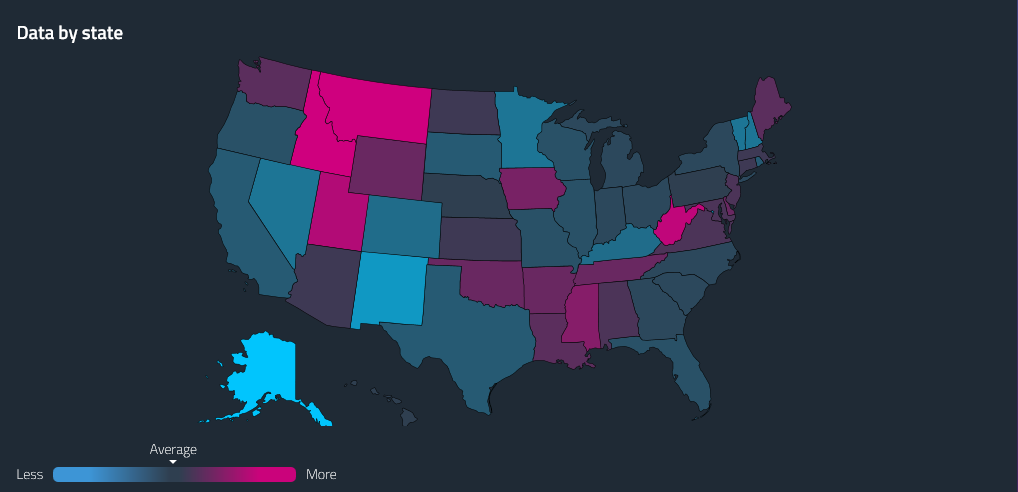
The infographic will then first show the popularity of the selected behavior and platform in each US state, in the form of a heat map:

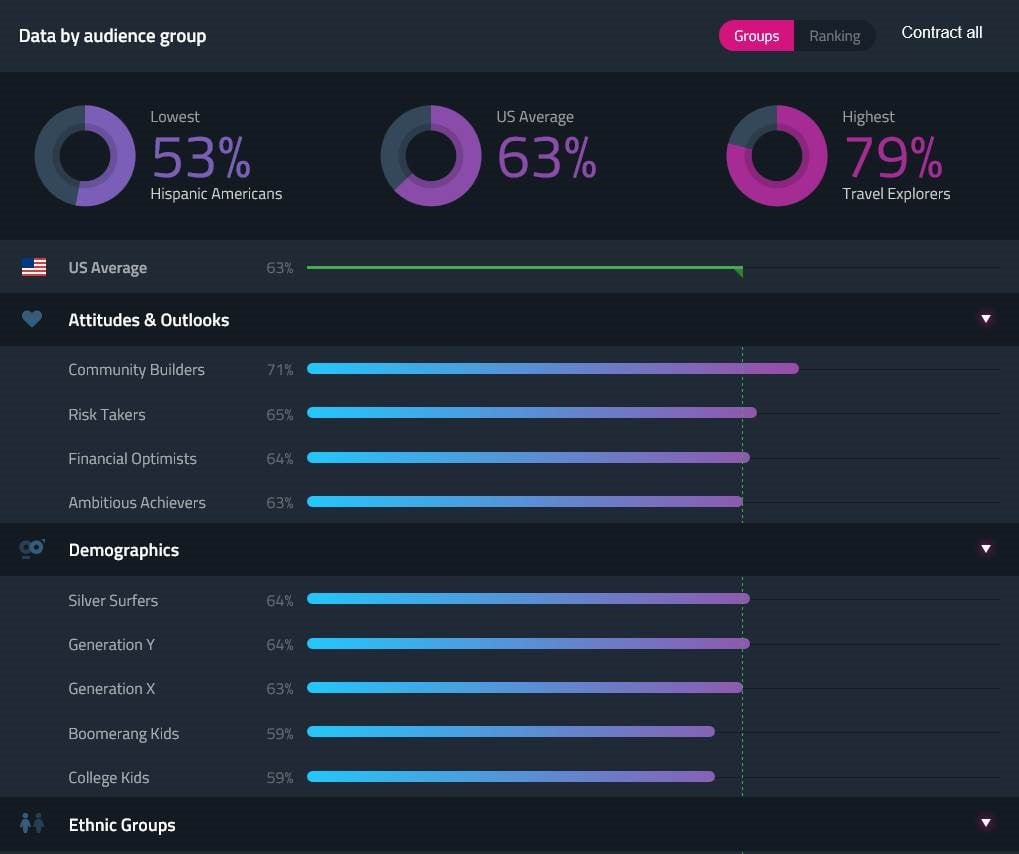
Scrolling further, the behaviors are then quantified for each audience group, which can be expanded to show individual audiences:

Results can also be ranked from high to low, by toggling the tab above the results:

Key Findings
The infographic clearly shows large behavioral variance across a broad variety of audiences, that have been created using a mix of demographic attributes and self-perception statements. Users of the infographic can download an accompanying white paper to explore this dynamic further, which describes the results of an internal GlobalWebIndex study into the most accurate predictors of online behavior.
Some key insights discovered include:
- Attitudes and self-perceptions (identity) are far more accurate predictors of online behaviors than demographics
- Audiences with more detailed definitions show higher engagement scores across all devices and behaviors
- Correctly-defined attitudinal groups can display unexpected behavior, e.g. 55+ year olds with certain attributes can be more digitally engaged on mobile and tablet than 16-24 year olds


